V8: Behind the Scenes (December Edition feat. WebAssembly and Real World Performance)
Following up on what I promised earlier here's another edition on what's going on behind the scenes of V8 as we are approaching the end of the year. A lot of cool stuff happened in V8 in 2016, probably most importantly that we are changing the focus of V8 to treat Node.js as a first class citizen (similar to Chrome) and moving away from measuring performance only via traditional JavaScript benchmarks to measuring actual performance of real world web pages via tooling built into the browser.
WebAssembly and asm.js #
Native WebAssembly support is expected to hit the stable versions of all four browsers in the first half of 2017, but since there's no polyfill available (partially because WebAssembly semantics for heap access are different from asm.js), only some big players on the web are expected to deliver native WebAssembly bytecode and a separate asm.js fallback based on browser feature detection; the majority of native code on the web users will likely continue to ship asm.js for the next two to three years (based on experience with other new web platform features).
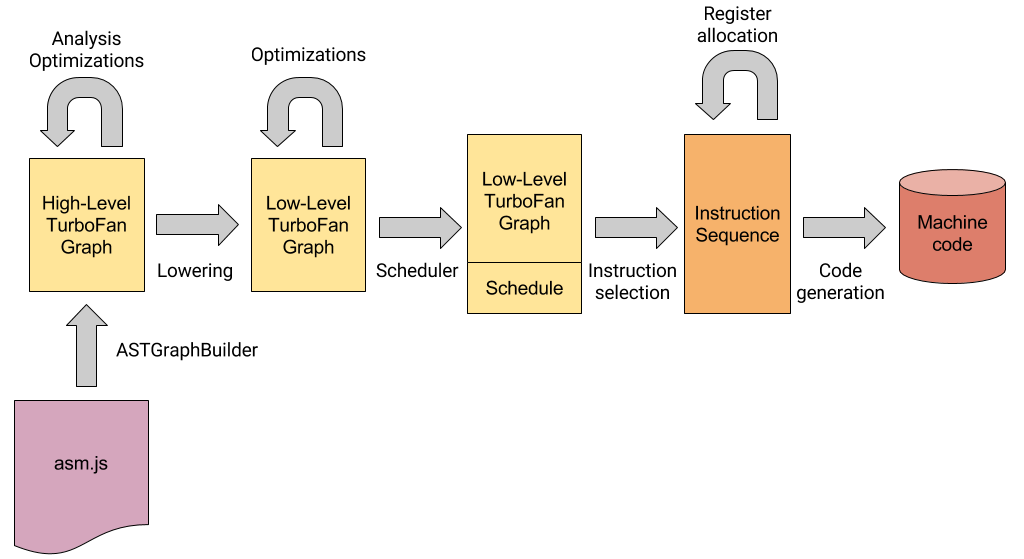
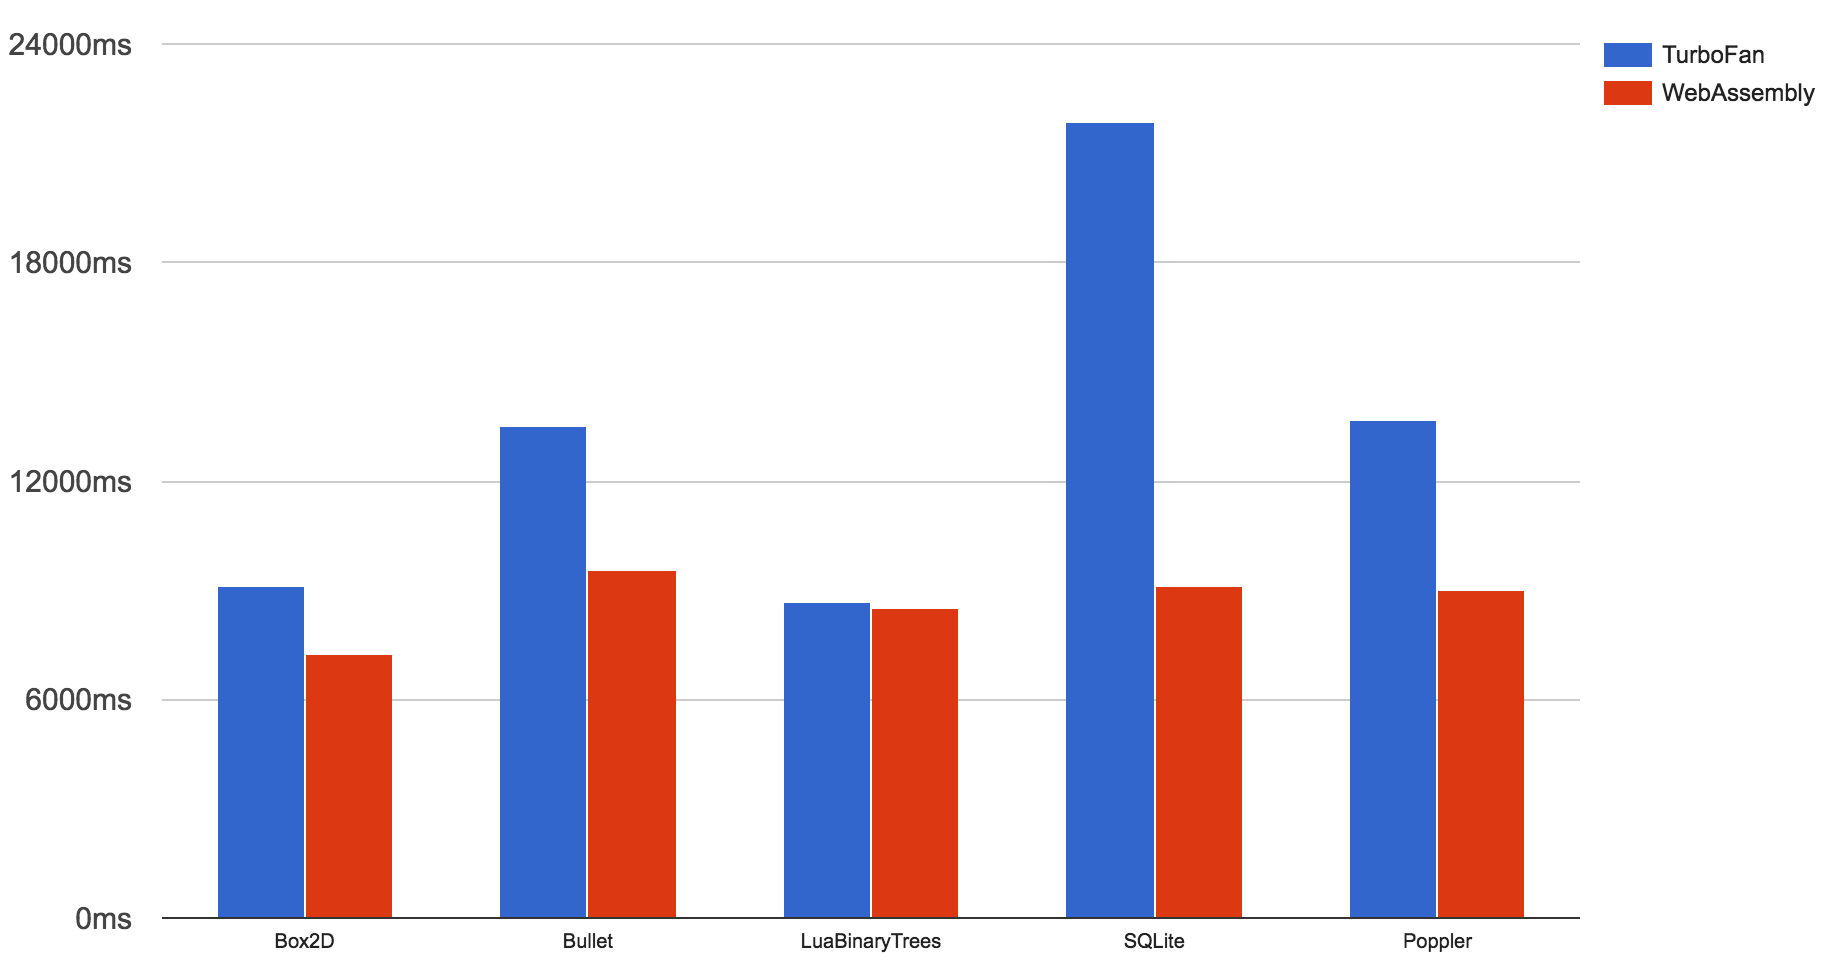
Thus most users will not be able to benefit from the WebAssembly compilation and execution engine we built into Chrome directly. So we built a small wrapper around the WebAssembly component in V8, that allows it to also consume native code input via asm.js in addition to the native bytecode format. Two weeks ago we staged the new asm.js pipeline, which sends asm.js code through the new WebAssembly pipeline instead of the TurboFan JavaScript compiler pipeline, and executes the resulting machine code in the WebAssembly native execution environment. This allows you to leverage many of the benefits of WebAssembly today and brings ahead-of-time compilation (AOT) for asm.js to Chrome, with full backwards compatibility.
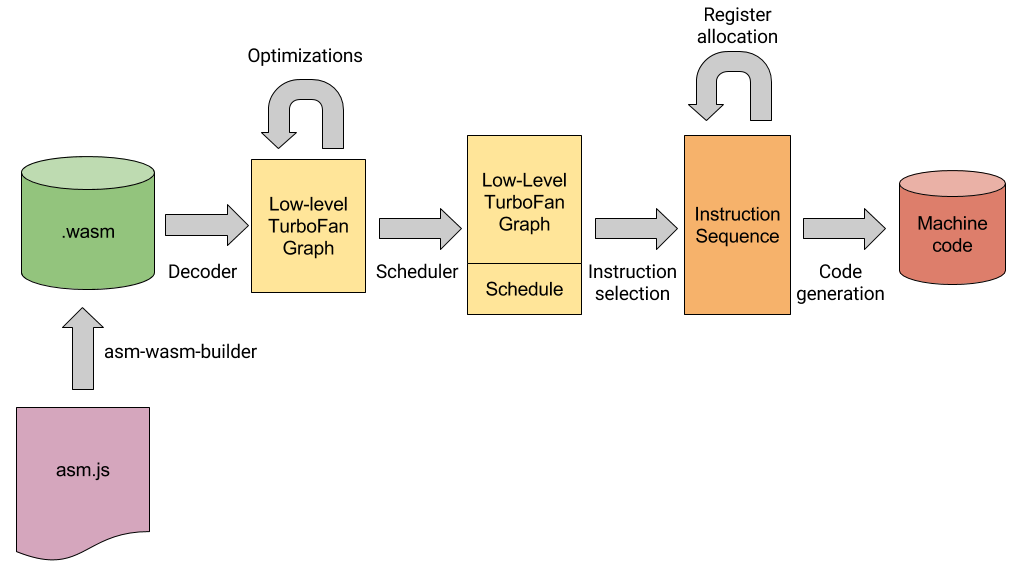
The WebAssembly compilation pipeline reuses some backend parts of the TurboFan compiler pipeline, and is therefore able to generate similar code, but with a lot less compilation and optimization overhead, and leveraging various benefits of the WebAssembly execution environment. For example, the asm-wasm-builder extracts the asm.js type annotation and uses those to generate typed WebAssembly code. If it hits any unsupported language constructs, it will just bail out and we will fall back to the TurboFan JavaScript compiler pipeline for this asm.js module. In contrast TurboFan must be able to deal with the whole EcmaScript 2017 language and can only consume a fraction of the static type information. For example consider the following asm.js module:
function Module(stdlib) {
  "use asm";
  function f(x) {
    x = +x;
    x = x * x;
    return +x;
  }
  function g(x) {
    x = +x;
    x = +f(x);
    return +x;
  }
  return { g: g };
}
It contains two functions f and g, the latter being exported and callable by regular JavaScript code, i.e. g is an entrypoint to the asm.js module. g doesn't do much but calls f with whatever input you pass to g converted to a Number. According to the asm.js type annotations, f has type double -> double, but this information is only usable as long as the asm.js module validates, i.e. passes the type checks in the asm.js specification. The asm-wasm-builder does the necessary validation and is thus able to generate code that leverages this type information without having to perform type checks at runtime (type checks are still necessary on the boundary to JavaScript obviously). In this concrete example, the asm-wasm-builder knows after validation that f is only used internally in the asm.js module (i.e. it's not exported to JavaScript) and all call sites pass a double and expect a double as result. For example, let's run the module above through the new WebAssembly pipeline:
$ ~/Projects/v8/out/Debug/d8 --validate-asm --trace-wasm-decoder asm.js
[...SNIP...]
  +0  local decls count   : 00 = 0
local decls count: 0
  env = 0x7f4fde004250, state = R, reason = initial, control = #1:Start
wasm-decode 0x7f4fddffebf3...0x7f4fddffec0c (module+92, 25 bytes) graph building
  env = 0x7f4fde004278, state = R, reason = initial env, control = #11:Merge
  @1        #20:GetLocal            | d@1:GetLocal[0]
  @3        #44:F64Const            | d@1:GetLocal[0] d@3:F64Const
  @12       #a2:F64Mul              | d@12:F64Mul
  @13       #21:SetLocal            |
  @15       #20:GetLocal            | d@15:GetLocal[0]
  @17       #20:GetLocal            | d@15:GetLocal[0] d@17:GetLocal[0]
  @19       #a2:F64Mul              | d@19:F64Mul
  @20       #21:SetLocal            |
  @22       #20:GetLocal            | d@22:GetLocal[0]
  @24       #0f:Return              |
wasm-decode ok
[...SNIP...]
asm.js:1: Converted asm.js to WebAssembly: success
asm.js:1: Instantiated asm.js: success
This shows the WebAssembly bytecode generated for the function f. As you can see the code doesn't need to perform any type checks on the input; there's still a somewhat unnecessary F64Mul of x and 1.0 in there, but the TurboFan backend will eliminate this prior to code generation. The final code generated for f using WebAssembly looks like this:
                  -- B0 start (no frame) --
0x10a04e985b00     0  493ba5780c0000 REX.W cmpq rsp,[r13+0xc78]
0x10a04e985b07     7  0f8605000000   jna 18  (0x10a04e985b12)
                  -- B2 start (no frame) --
                  -- B3 start (no frame) --
0x10a04e985b0d    13  c5f359c9       vmulsd xmm1,xmm1,xmm1
0x10a04e985b11    17  c3             retl
                  -- B4 start (no frame) --
                  -- B1 start (deferred) (construct frame) (deconstruct frame) --
0x10a04e985b12    18  55             push rbp
0x10a04e985b13    19  4889e5         REX.W movq rbp,rsp
0x10a04e985b16    22  49ba0000000006000000 REX.W movq r10,0x600000000
0x10a04e985b20    32  4152           push r10
0x10a04e985b22    34  4883ec08       REX.W subq rsp,0x8
0x10a04e985b26    38  c5fb114df0     vmovsd [rbp-0x10],xmm1
0x10a04e985b2b    43  48bb10e4f40f317f0000 REX.W movq rbx,0x7f310ff4e410    ;; external reference (Runtime::StackGuard)
0x10a04e985b35    53  48bef93b5006492e0000 REX.W movq rsi,0x2e4906503bf9    ;; object: 0x2e4906503bf9 <FixedArray[255]>
0x10a04e985b3f    63  33c0           xorl rax,rax
0x10a04e985b41    65  e8bae6e7ff     call 0x10a04e804200     ;; code: STUB, CEntryStub, minor: 8
0x10a04e985b46    70  c5fb104df0     vmovsd xmm1,[rbp-0x10]
0x10a04e985b4b    75  488be5         REX.W movq rsp,rbp
0x10a04e985b4e    78  5d             pop rbp
0x10a04e985b4f    79  ebbc           jmp 13  (0x10a04e985b0d)
0x10a04e985b51    81  0f1f00         nop
It first does a so-called stack check, which checks that we don't exceed a certain stack limit; besides guarding against stack overflows, this mechanism is used by Chrome to be able to interrupt the main thread of the renderer process, for example by DevTools, or to kill a tab that is executing an endless loop. The code then computes the square of the input, which is passed and returned in machine register xmm1 (WebAssembly has its own native calling convention that is slightly different from the usual platform calling conventions). Contrast this with the code generated via the TurboFan JavaScript compiler pipeline:
                  -- B0 start (construct frame) --
0x26d963005ec0     0  55             push rbp
0x26d963005ec1     1  4889e5         REX.W movq rbp,rsp
0x26d963005ec4     4  56             push rsi
0x26d963005ec5     5  57             push rdi
0x26d963005ec6     6  4883ec08       REX.W subq rsp,0x8
0x26d963005eca    10  493ba5780c0000 REX.W cmpq rsp,[r13+0xc78]
0x26d963005ed1    17  0f8657000000   jna 110  (0x26d963005f2e)
                  -- B2 start --
                  -- B3 start --
0x26d963005ed7    23  488b4510       REX.W movq rax,[rbp+0x10]
0x26d963005edb    27  a801           test al,0x1
0x26d963005edd    29  0f8566000000   jnz 137  (0x26d963005f49)
                  -- B8 start --
0x26d963005ee3    35  48c1e820       REX.W shrq rax, 32
0x26d963005ee7    39  c5f957c0       vxorpd xmm0,xmm0,xmm0
0x26d963005eeb    43  c5fb2ac0       vcvtlsi2sd xmm0,xmm0,rax
                  -- B9 start --
0x26d963005eef    47  498b85d80c0400 REX.W movq rax,[r13+0x40cd8]
0x26d963005ef6    54  488d5810       REX.W leaq rbx,[rax+0x10]
0x26d963005efa    58  49399de00c0400 REX.W cmpq [r13+0x40ce0],rbx
0x26d963005f01    65  0f866f000000   jna 182  (0x26d963005f76)
                  -- B11 start --
                  -- B12 start (deconstruct frame) --
0x26d963005f07    71  488d5810       REX.W leaq rbx,[rax+0x10]
0x26d963005f0b    75  4883c001       REX.W addq rax,0x1
0x26d963005f0f    79  49899dd80c0400 REX.W movq [r13+0x40cd8],rbx
0x26d963005f16    86  498b5d50       REX.W movq rbx,[r13+0x50]
0x26d963005f1a    90  488958ff       REX.W movq [rax-0x1],rbx
0x26d963005f1e    94  c5fb59c0       vmulsd xmm0,xmm0,xmm0
0x26d963005f22    98  c5fb114007     vmovsd [rax+0x7],xmm0
0x26d963005f27   103  488be5         REX.W movq rsp,rbp
0x26d963005f2a   106  5d             pop rbp
0x26d963005f2b   107  c21000         ret 0x10
                  -- B13 start (no frame) --
                  -- B1 start (deferred) --
0x26d963005f2e   110  488975f8       REX.W movq [rbp-0x8],rsi
0x26d963005f32   114  48bb10f4ddd8da7f0000 REX.W movq rbx,0x7fdad8ddf410    ;; external reference (Runtime::StackGuard)
0x26d963005f3c   124  33c0           xorl rax,rax
                  -- <asm.js:3:13> --
0x26d963005f3e   126  e8bde2e7ff     call 0x26d962e84200     ;; code: STUB, CEntryStub, minor: 8
0x26d963005f43   131  488b75f8       REX.W movq rsi,[rbp-0x8]
0x26d963005f47   135  eb8e           jmp 23  (0x26d963005ed7)
                  -- B4 start (deferred) --
0x26d963005f49   137  488975f8       REX.W movq [rbp-0x8],rsi
0x26d963005f4d   141  488b4510       REX.W movq rax,[rbp+0x10]
0x26d963005f51   145  e86a2cefff     call ToNumber  (0x26d962ef8bc0)    ;; code: BUILTIN
0x26d963005f56   150  a801           test al,0x1
0x26d963005f58   152  0f8407000000   jz 165  (0x26d963005f65)
                  -- B5 start (deferred) --
0x26d963005f5e   158  c5fb104007     vmovsd xmm0,[rax+0x7]
0x26d963005f63   163  eb8a           jmp 47  (0x26d963005eef)
                  -- B6 start (deferred) --
0x26d963005f65   165  48c1e820       REX.W shrq rax, 32
0x26d963005f69   169  c5f957c0       vxorpd xmm0,xmm0,xmm0
0x26d963005f6d   173  c5fb2ac0       vcvtlsi2sd xmm0,xmm0,rax
0x26d963005f71   177  e979ffffff     jmp 47  (0x26d963005eef)
                  -- B7 start (deferred) --
                  -- B10 start (deferred) --
0x26d963005f76   182  c5fb1145e8     vmovsd [rbp-0x18],xmm0
0x26d963005f7b   187  ba10000000     movl rdx,0x10
0x26d963005f80   192  e81bcdf4ff     call AllocateInNewSpace  (0x26d962f52ca0)    ;; code: BUILTIN
0x26d963005f85   197  4883e801       REX.W subq rax,0x1
0x26d963005f89   201  c5fb1045e8     vmovsd xmm0,[rbp-0x18]
0x26d963005f8e   206  e974ffffff     jmp 71  (0x26d963005f07)
It's a lot heavier since it has to use the JavaScript calling convention and the uniform tagging scheme, and it has to perform type checks and conversions on the input x, and in the end has to allocate a HeapNumber for the resulting value. This translates to a huge improvement in execution speed of bigger applications, which tend to consist of a lot of small to medium sized functions that are called very often, where having native calling conventions helps a lot. For micro-benchmarks that spend most of their time in a single loop or at least a single function, it is unlikely that you experience a lot of benefits from having asm.js code take the WebAssembly pipeline, because the TurboFan type inference does a great job at eliminating almost all type checks.
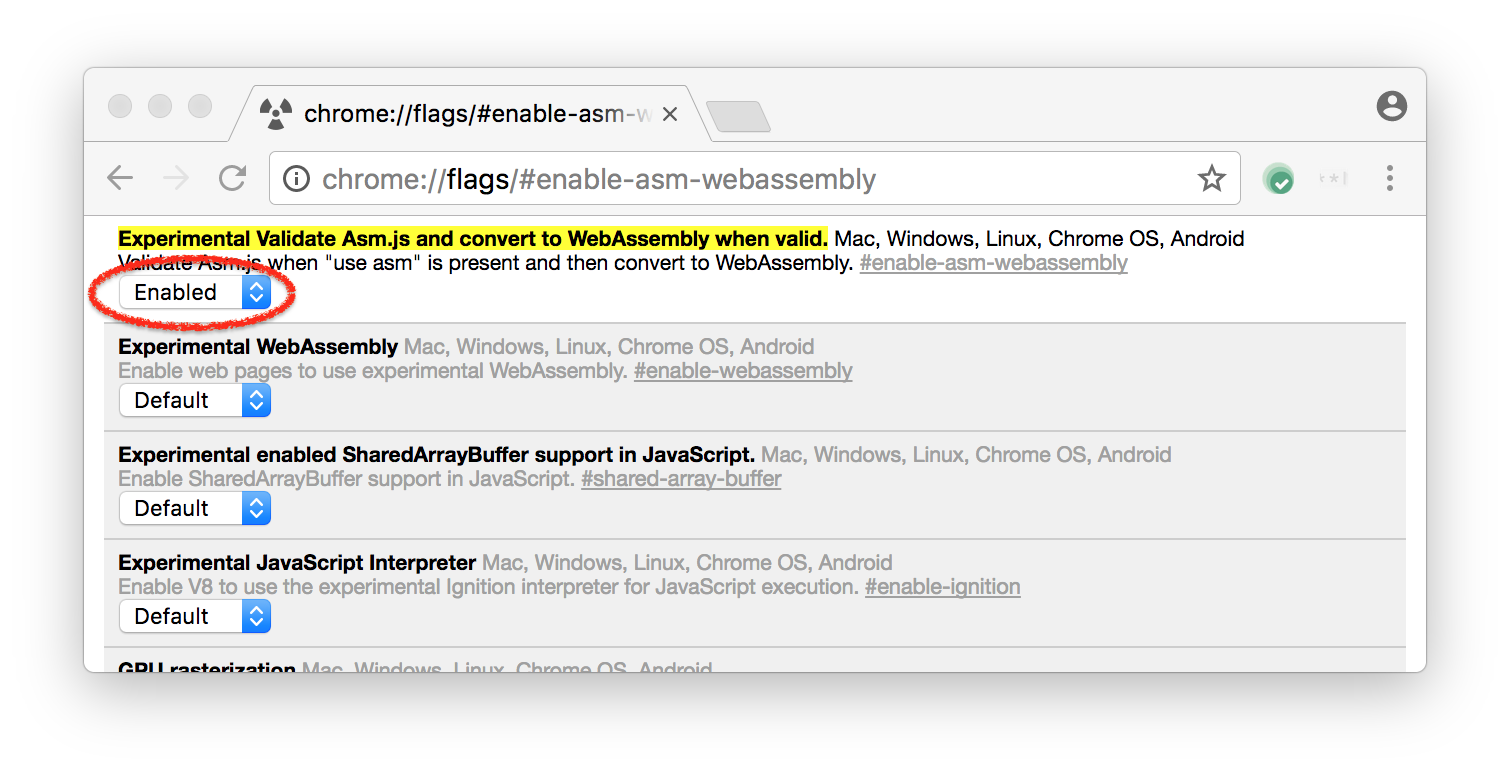
If you are running Chrome dev or canary channel, you can give it a try by enabling the experimental flag Experimental Validate Asm.js and convert to WebAssembly when valid and restarting Chrome.
The asm-wasm-builder will log information about asm.js module validation to the Chrome Developer Tools console, similar to what Firefox does, so you can easily verify that a certain asm.js module is recognized as valid:
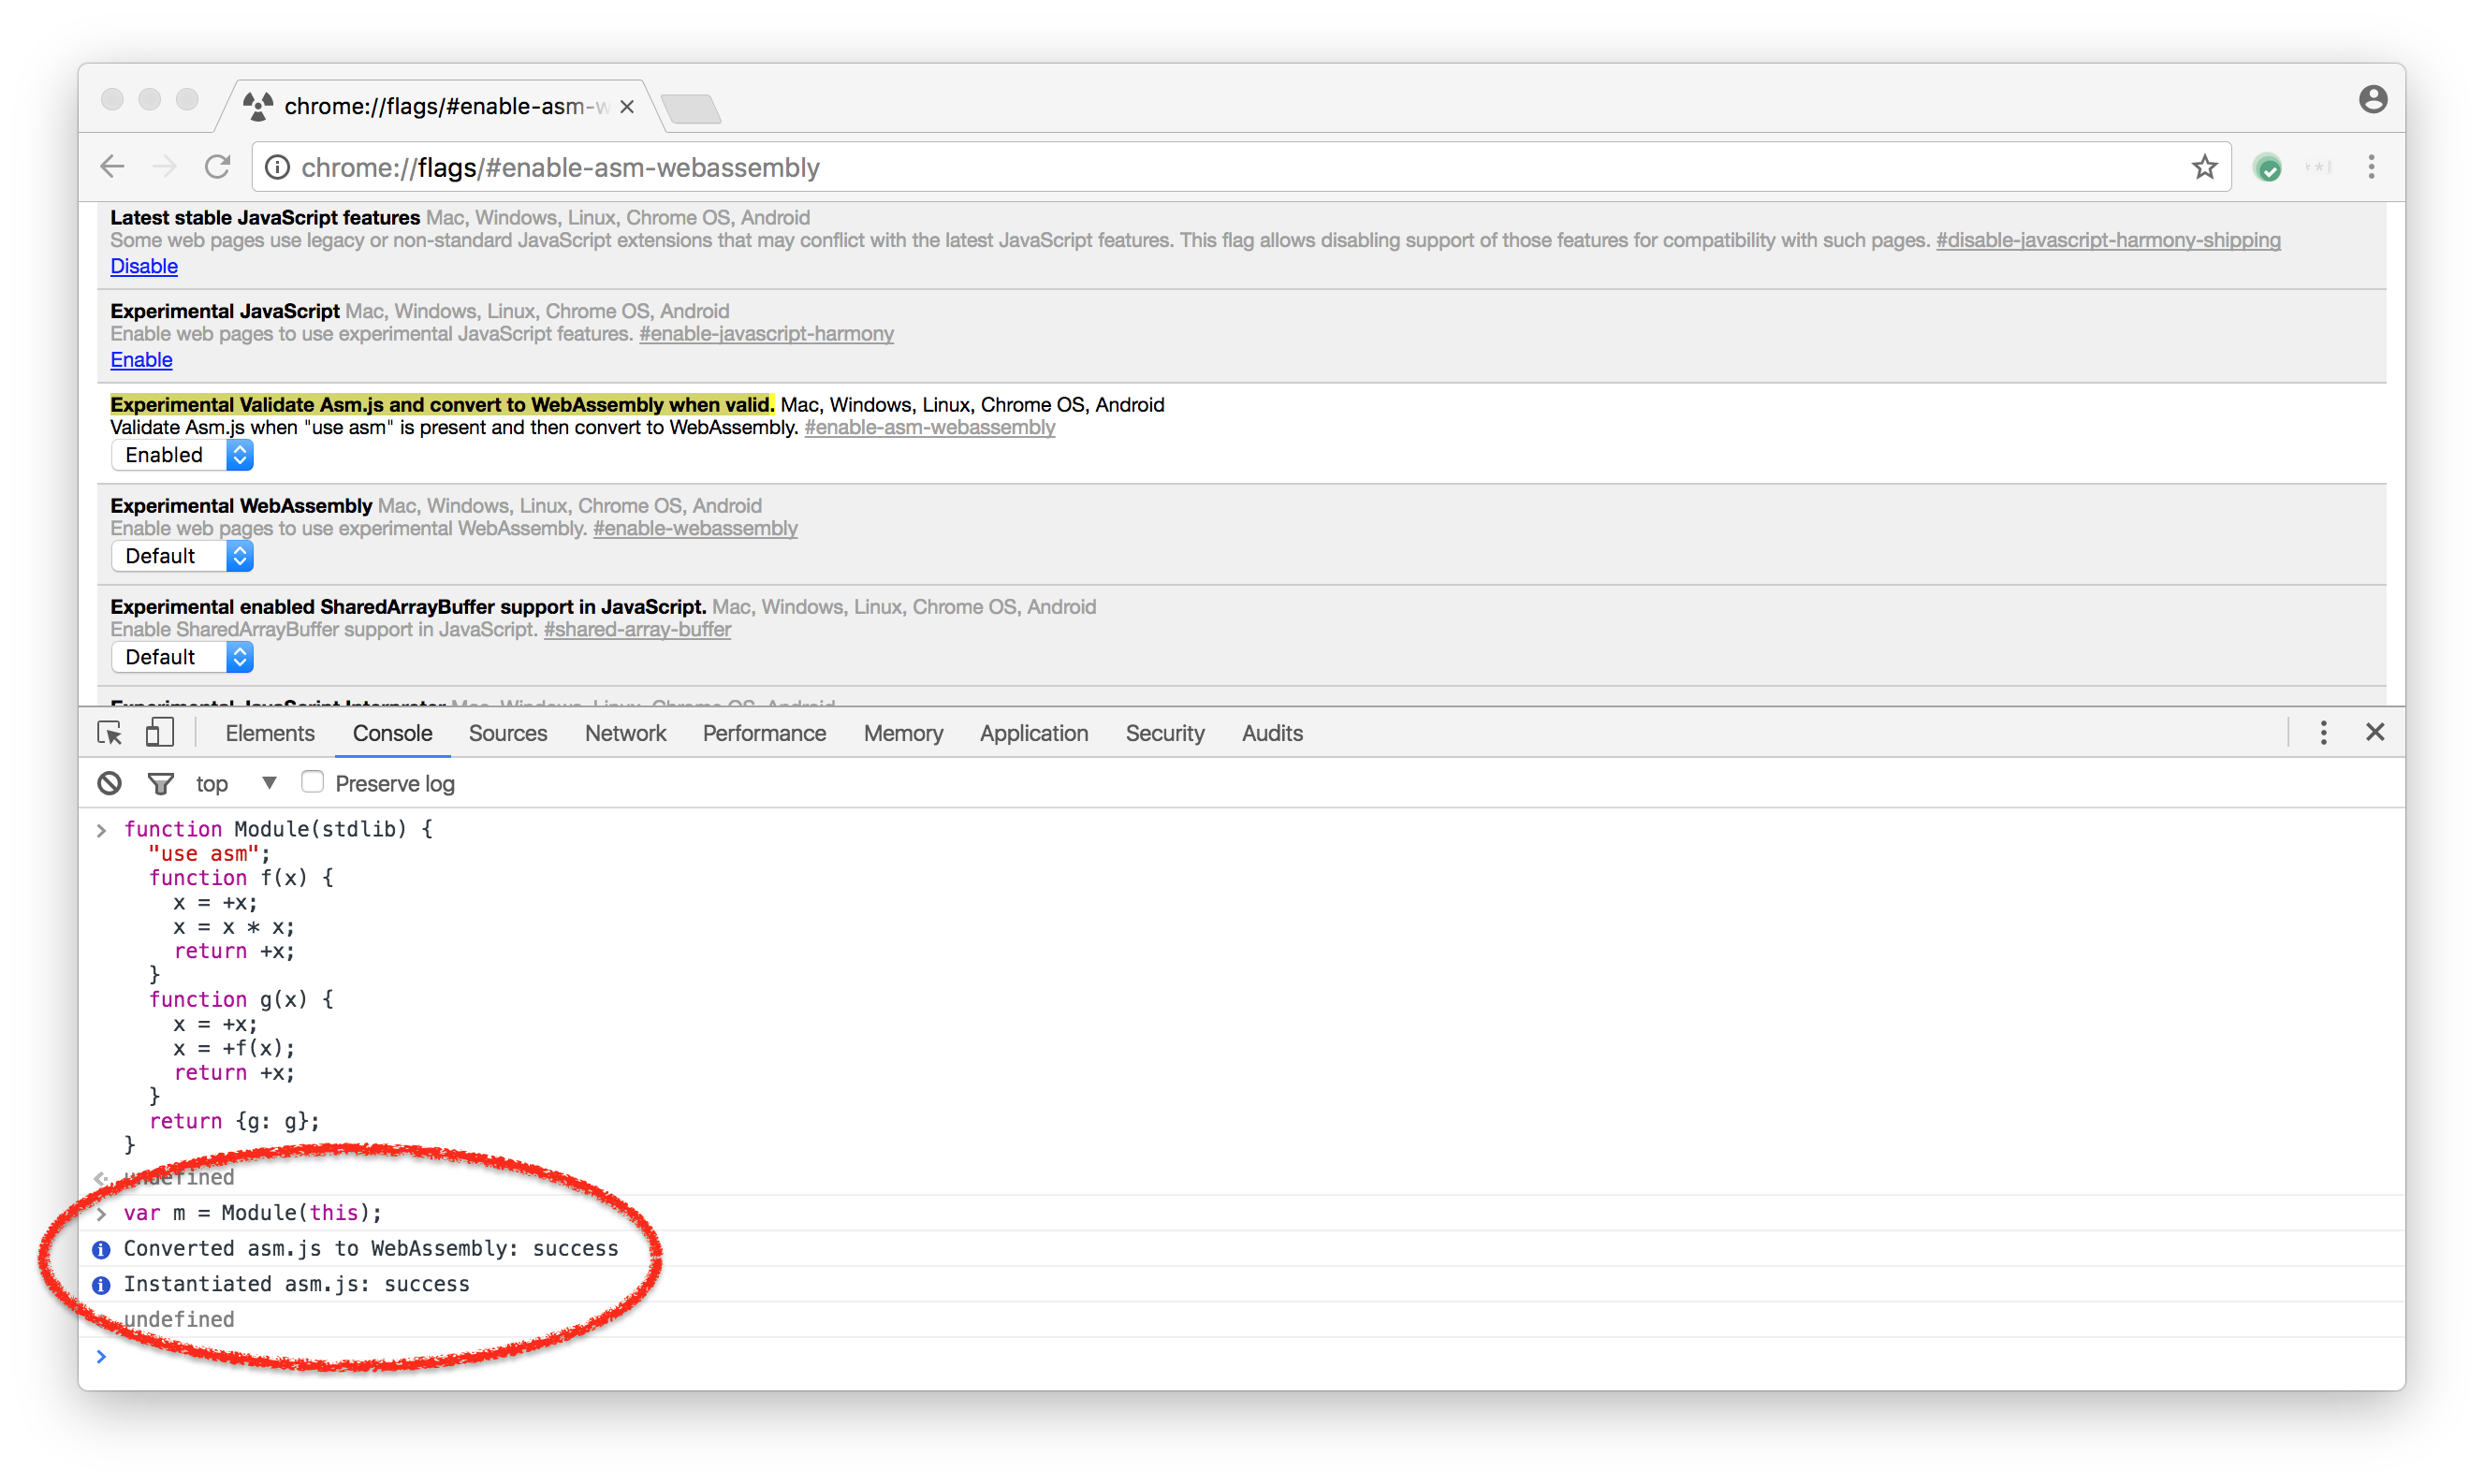
We expect to be able to enable this by default in early 2017 unless we hit some terrible stability or security problems.
Real world performance measurements #
As mentioned in my blog post about JavaScript benchmarks, we've been investigating a lot in techniques to properly measure real world performance, especially on the web. We've added a lot of tracing support to V8 and Chrome for that, especially also tracing various internals of V8. One of the new tracing options is the so-called Runtime Call Stats in V8, which collects precise timing information for all V8 components. This is accessible via chrome://tracing and gives you pretty detailed information about where time in V8 is spent.
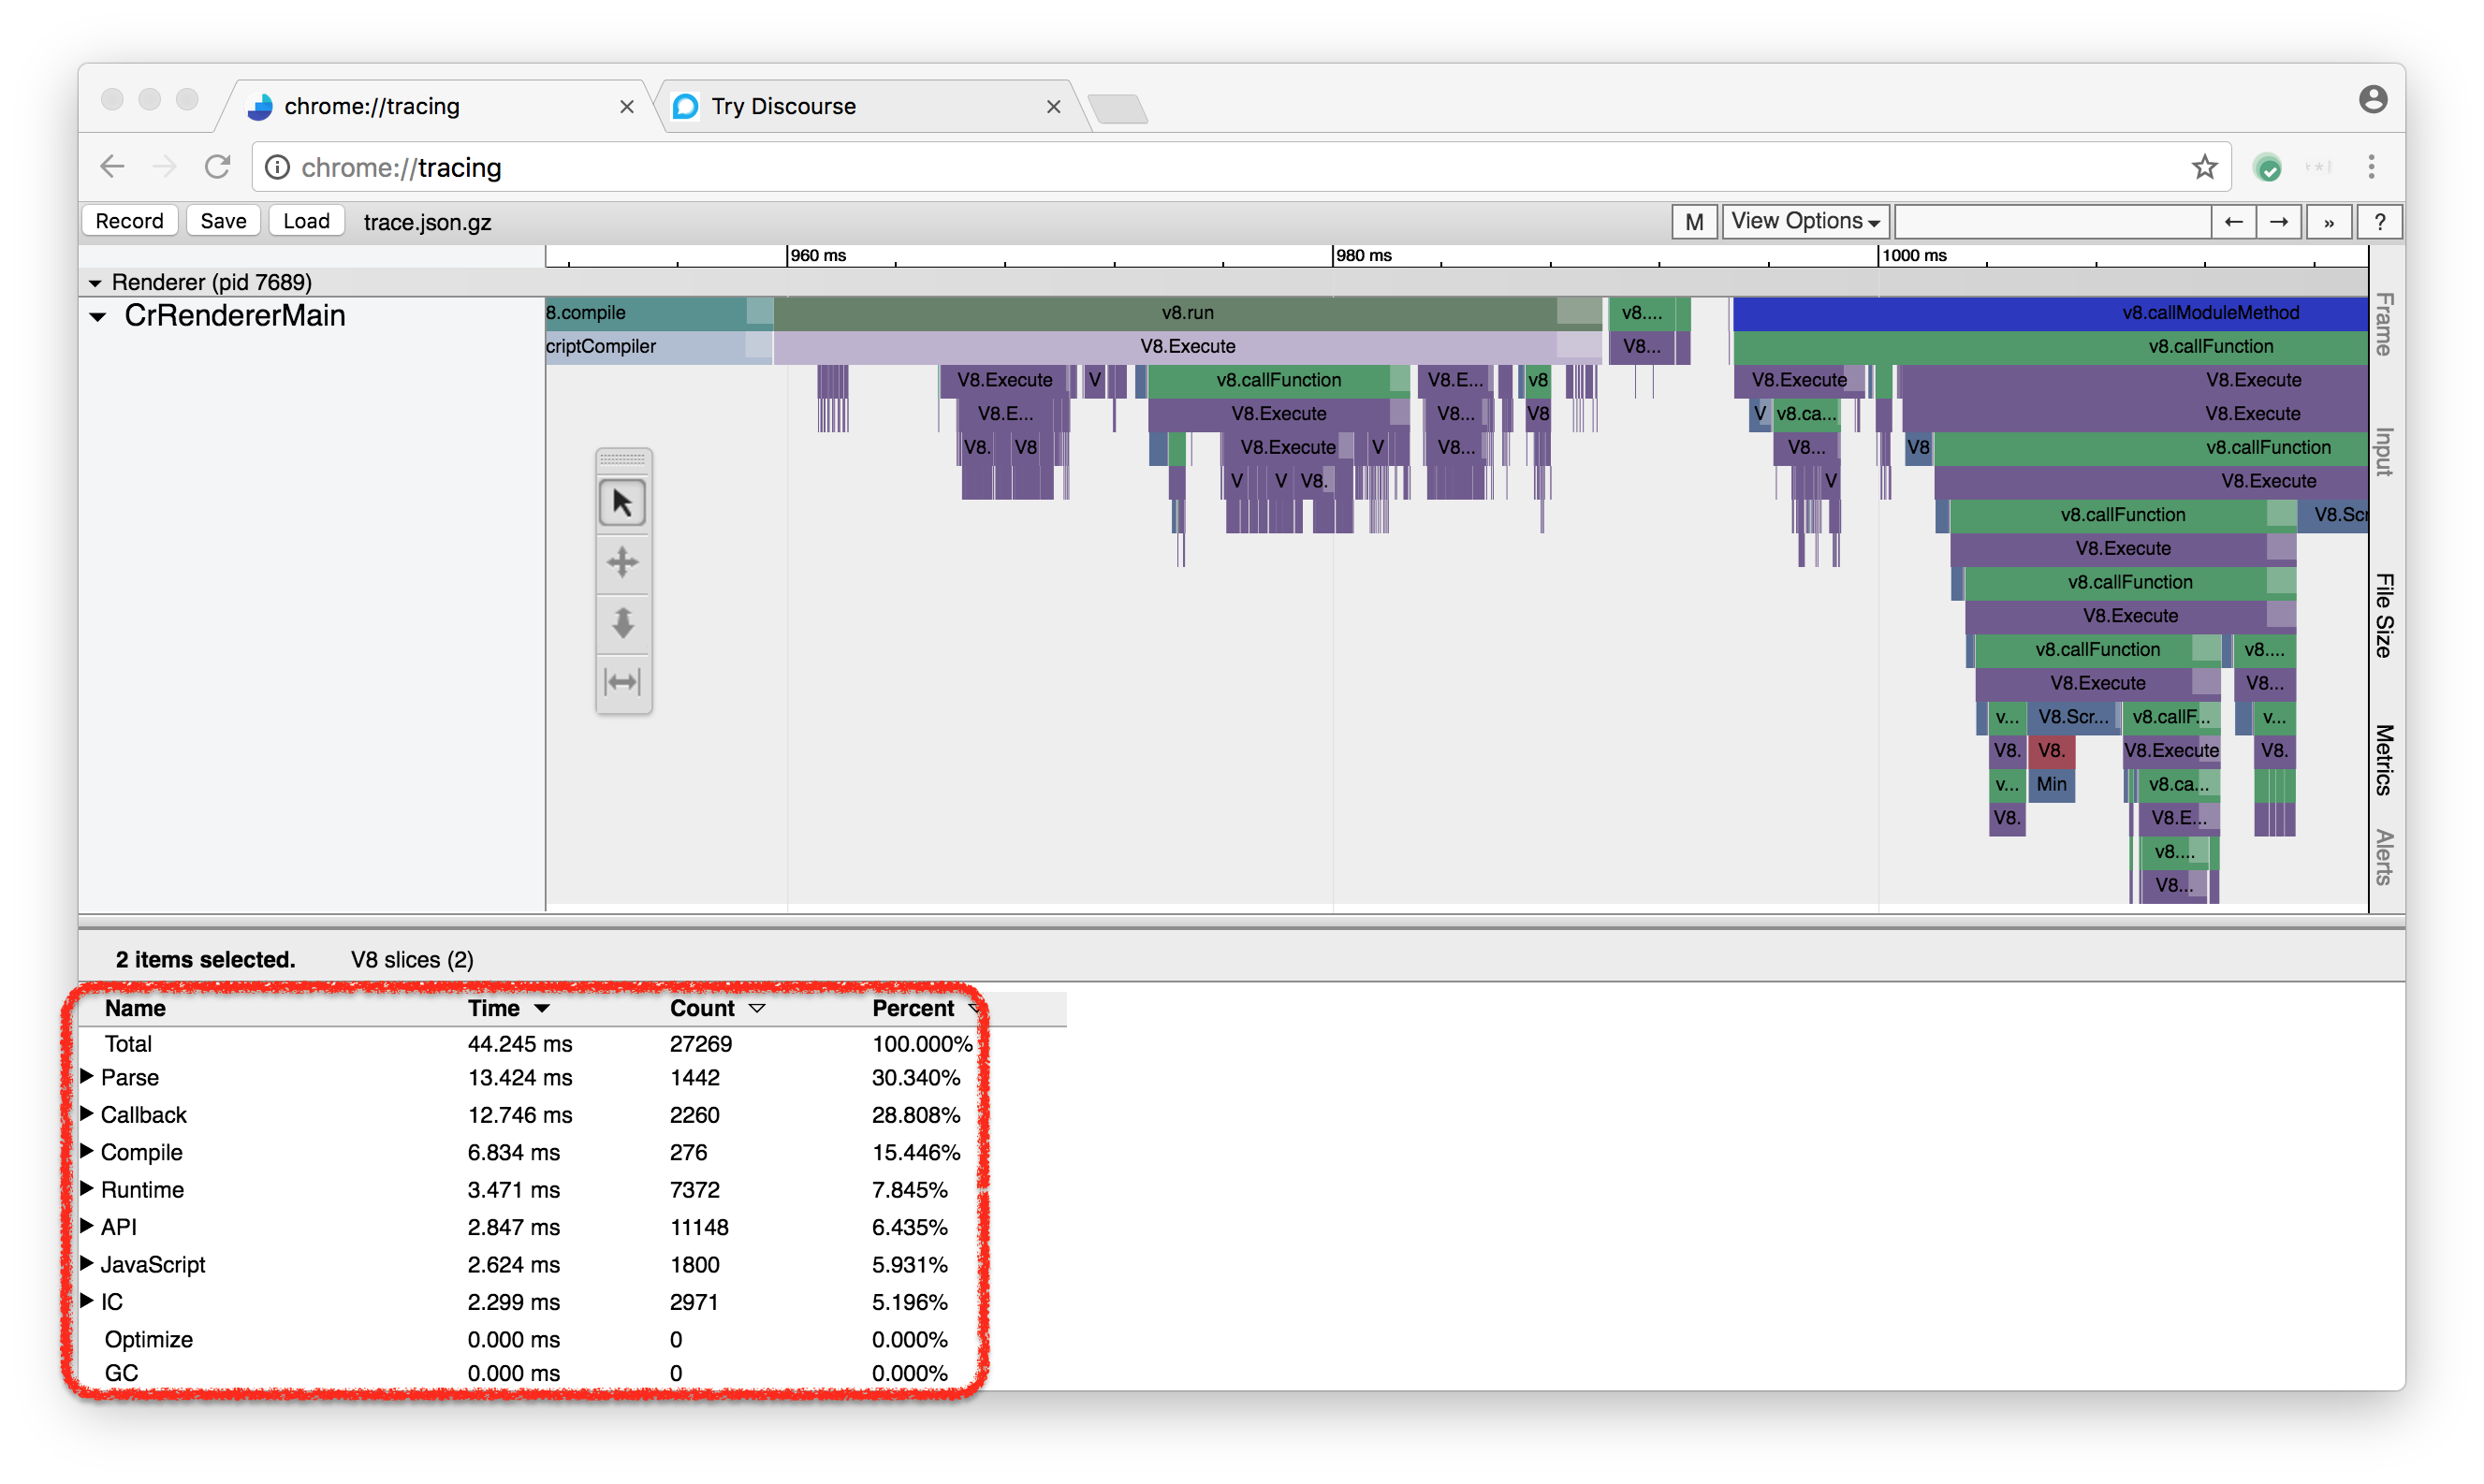
Currently this requires quite a bit of knowledge about V8 to really draw useful conclusions from this, but we're working on better integration with the developer tools in Chrome (i.e. by exposing the stats via lighthouse). Initially it was mostly useful for us internally since we had to understand where todays web pages spent most of their time in V8, but nevertheless you can probably still use some of the data that is gathered. For example you can check how much overall time is spent preparsing your scripts:
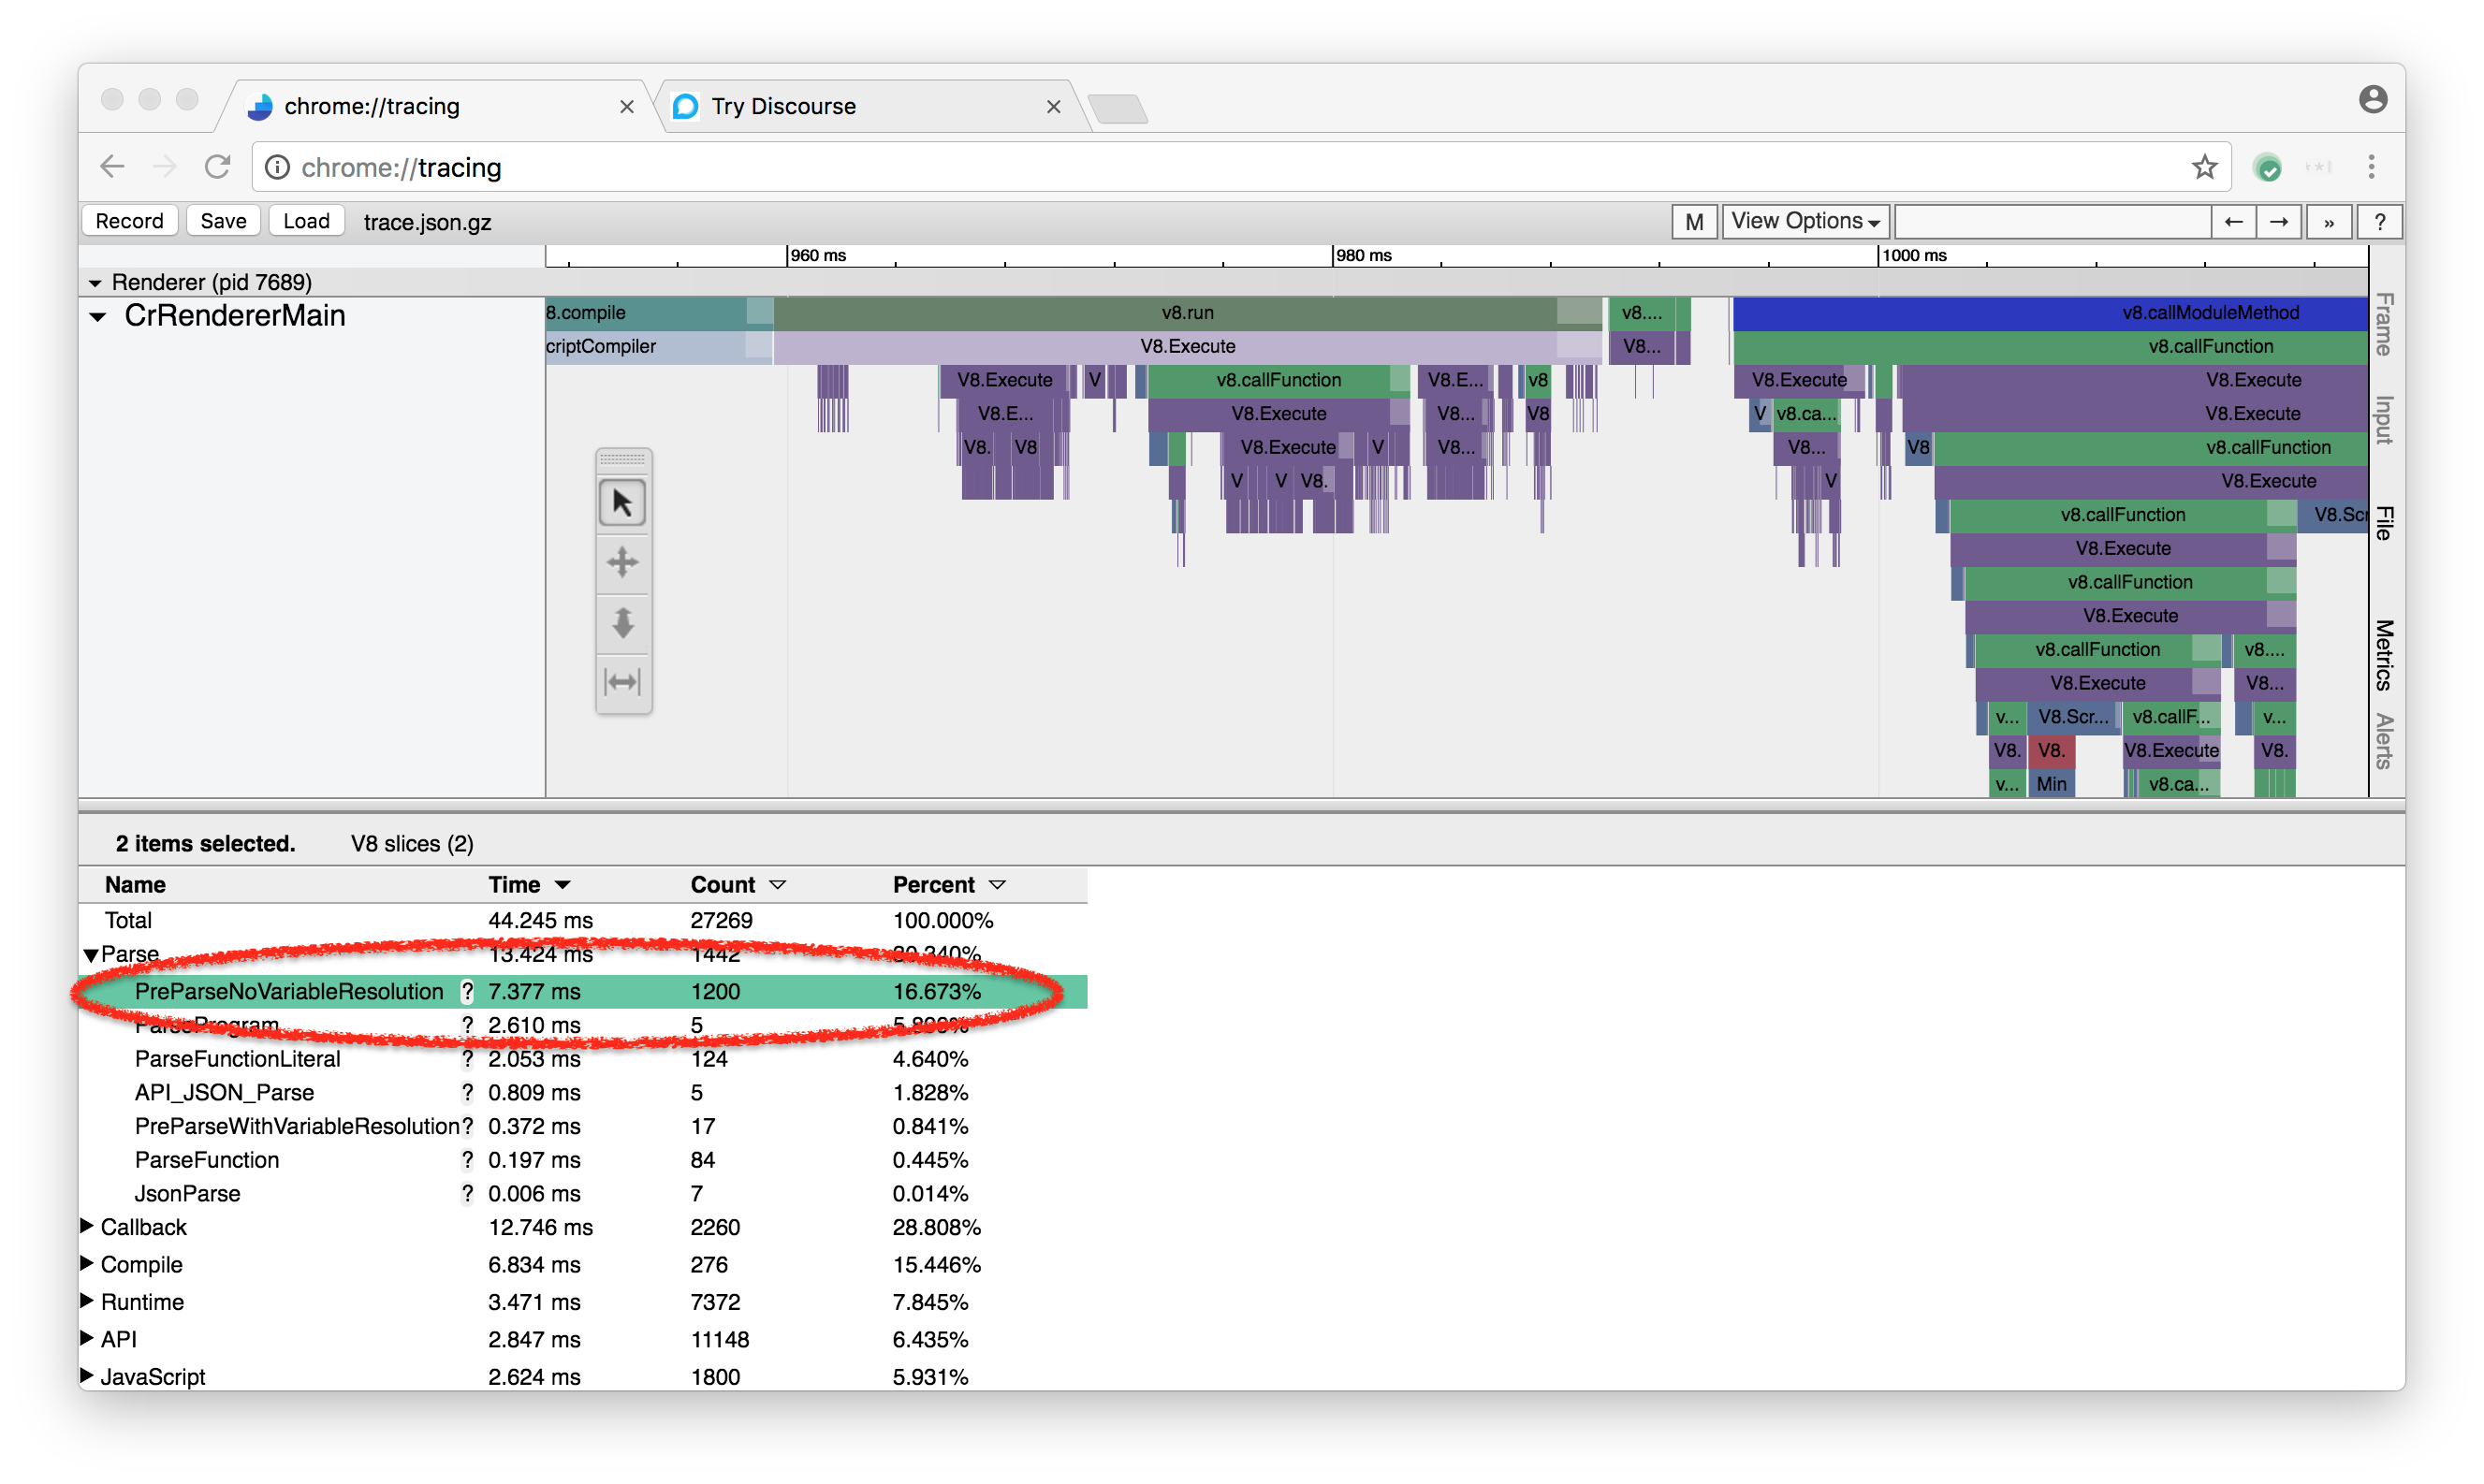
This is a good indicator whether your JavaScript bundles are bigger than they should be. For example in case of the discourse demo page we have to preparse 1217 times, but parse only 213 times. This doesn't automatically mean that only 1/6th of the overall script bundles are being needed due to the way that parsing works internally in V8, but it's an indicator that looking into script size might be a good investment of the developers time.
We plan to make these measurement tools more accessible during 2017 and provide developers with better insight into V8 performance. We also plan to continue our effort to focus on real world performance improvements rather than looking at benchmarks only, which was the main driver in the past.
If you haven't done so, be sure to watch the BlinkOn 6 talk on Real-world JavaScript performance from my colleagues Toon Verwaest and Camillo Bruni.
Update #
Apparently there's a slide deck from my colleagues Camillo Bruni from the V8 runtime team and Michael Lippautz from the V8 GC team that describes how to get to the Runtime Call Stats and the Heap Stats in chrome://tracing.

It should give you a rough idea how to use the new functionality in Chrome.